

Today’s study is about
Normality test
This method tests whether a sample is accurately selected from the population.
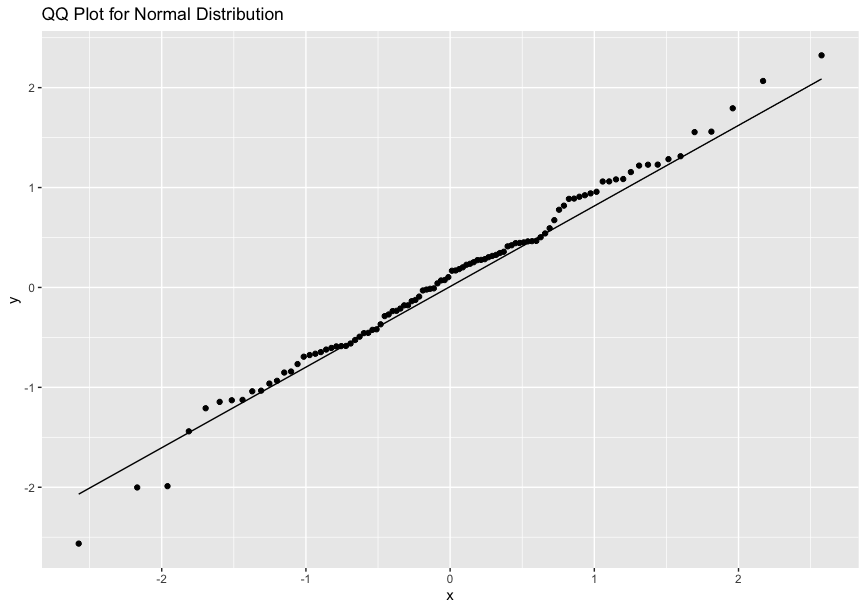
Quantile-Quantile Plot(Q-Q Plot)
The formula for the empirical distribution function is:
\[ F_n(x) = \frac{1}{n} \sum_{i=1}^{n} I(X_i \leq x) \]
According to the law of large numbers, the empirical distribution function approaches the distribution function of the population.
A Q-Q Plot is a scatter plot that compares the empirical distribution to the ideal distribution.
If the points on the Q-Q plot form a linear pattern, the data conforms to the ideal distribution.
Skewness and Kurtosis
\[ skewness = \frac{1}{n} \sum_{i=1}^{n} \left( \frac{x_i – \bar{x}}{s} \right)^3 \]
\[ kurtosis = \frac{1}{n} \sum_{i=1}^{n} \left( \frac{x_i – \bar{x}}{s} \right)^4 – 3 \]
For a normal distribution, both skewness and kurtosis are close to zero.
Goodness of fit test
This test evaluates the goodness of fit between observed and expected frequencies.
Under the null hypothesis
, the following value conforms to the
distribution:
\[ \chi^2 = \sum \frac{(O_i – E_i)^2}{E_i} \]
Independence test
The null hypothesis for the independence test is:
\[ E_{ij} = \frac{n_{i \cdot} \times n_{\cdot j}}{n} \]
then,
\[ \chi^2 = \sum \frac{(O_{ij} – E_{ij})^2}{E_{ij}} \]
This conforms to the
distribution.
Today’s study is complete.

コメント